
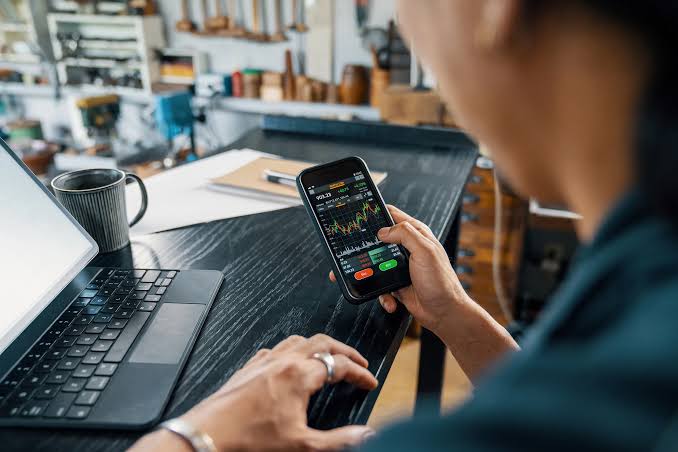
Watching several markets is not simply a matter of opening more charts. The harder task is seeing how movements in currencies, commodities, bonds and equity indices relate to one another without losing track of open exposure.
A well-organized trader terminal brings prices, charts, news, orders and account information into one workspace. The value is not the number of instruments displayed. It is the ability to notice when activity in one market changes the meaning of a move elsewhere.
One View of Prices and Positions
A market watch panel typically shows live bid and ask prices across selected instruments. Traders can arrange currency pairs, stock indices, metals and energy contracts into groups, then open charts without repeatedly searching through the full product list.
The position panel is just as important. It shows open trades, entry prices, unrealized profit or loss, margin use and pending orders. When several markets are active, this consolidated view reveals whether total exposure has grown beyond what was originally intended.
Consider long positions in EUR/USD and GBP/USD alongside a short position in the US Dollar Index. The three trades may appear to involve different instruments, but each expresses a similar expectation of dollar weakness. A terminal that displays them together makes the concentration easier to recognise.
Separate charts can disguise shared risk.
Experienced traders often organise markets by underlying driver rather than by asset class. Gold, the dollar, US Treasury yields and major equity indices might share one workspace because all four can respond to changes in interest-rate expectations. That arrangement provides more context than placing every currency pair on one screen simply because each belongs to the same category.
Following a Market Reaction Across Assets
Suppose US inflation data comes in below forecasts. Treasury yields fall immediately as traders increase expectations for interest-rate cuts. The dollar weakens, gold breaks above a week-long consolidation and a US equity index rallies through resistance.
A trader watching only the gold chart sees a bullish breakout. Someone monitoring the related markets sees confirmation: lower yields reduce the opportunity cost of holding gold, while dollar weakness makes the metal less expensive for buyers using other currencies.
The first move may still fail. If yields reverse upward and the dollar recovers while gold remains above resistance, the breakout begins to look isolated. That divergence can warn that late buyers are supporting the move rather than a broad shift in macroeconomic expectations.
What appears strong on one chart can look vulnerable across four.
Real-time news feeds and economic calendars help explain why these movements begin, but speed has limits. A headline may identify the catalyst without revealing how the market will interpret it. Traders still need to observe which assets extend their moves, which reverse and where liquidity appears to be concentrating.
Alerts can reduce the need to stare at every chart. A price alert near support, resistance or a previous session high directs attention only when an instrument reaches a meaningful area. This is usually more useful than scanning dozens of candles that remain in the middle of established ranges.
More Information Can Create Less Awareness
The counterintuitive problem with a multi-market setup is that additional data can make a trader less informed. Ten flashing charts compete for attention, and every short-term movement begins to look significant. The terminal becomes a source of stimulation rather than a decision-making tool.
Professional-looking complexity is still complexity.
Experienced traders tend to remove panels that do not support a specific decision. A short-term currency trader may need major pairs, bond yields, a dollar index, an economic calendar and open positions. Twenty cryptocurrency charts and a stream of unrelated company earnings add activity without improving that process.
Order controls also require careful placement. One-click buttons make it possible to enter or exit quickly, but they can send an incorrect volume or direction just as efficiently. When multiple charts are tiled together, selecting the wrong instrument becomes a realistic operational risk.
A trader terminal works best when each screen has a defined purpose. One section might track broad market direction, another might hold instruments approaching planned entry levels, while a third displays current positions and account exposure.
Build the workspace around three lists: markets that provide context, markets that may produce a setup and positions already carrying risk. Limit each list to instruments you can explain in relation to the current session. Before entering, check whether existing trades already express the same market view. If three positions would all lose from a stronger dollar or rising yields, treat them as one concentrated exposure when calculating risk.